How Dental Practice Collections Actually Work
April 2026 • 10 min read
Collections is the number that pays your bills, your staff, and yourself. It’s the money that actually arrives. But most dental practice owners only see one number: the total deposited this month. That’s like watching your checking account balance without knowing where the money came from or what’s still owed to you.
This post breaks down how collections work in a dental practice, where the money comes from, what a healthy collection process looks like, and where practices most commonly lose money between the chair and the bank.
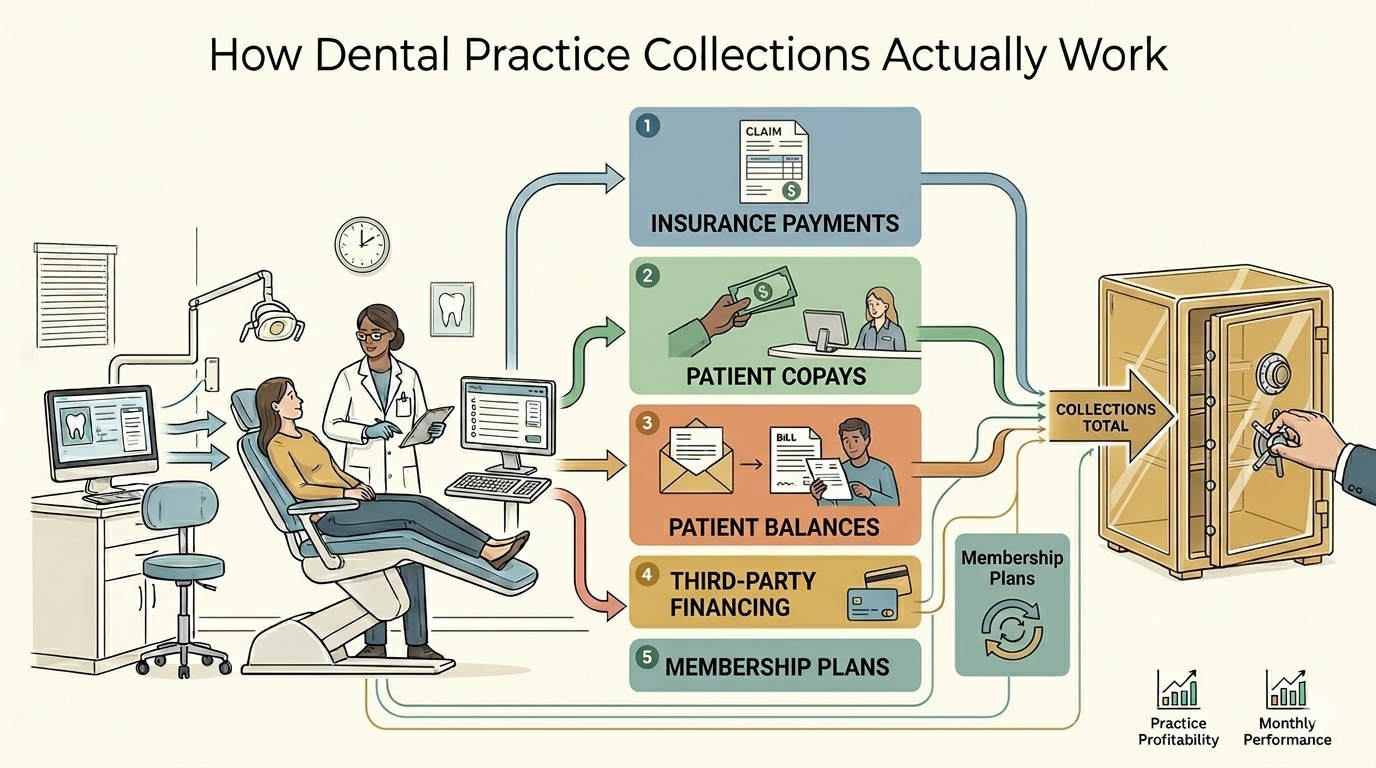
The Five Sources of Collections
Not all collections are created equal. Each source has its own timing, its own risks, and its own management requirements.
1. Insurance payments
For most general dental practices, insurance represents 50 to 70% of total collections, with PPO-heavy practices on the higher end and fee-for-service practices on the lower end. This is the largest and most complex source of revenue. Clean electronic claims pay within 14 to 30 days; claims that need additional documentation, coordination of benefits, or pre-authorization review can take 30 to 60 days, per Dental Claim Support. The lag between when work is performed and when insurance pays is what makes insurance timing one of the biggest distortions in your monthly P&L.
Insurance payments are determined by the contracted fee schedule (for in-network providers) or the carrier’s usual and customary rate (for out-of-network). You don’t control the amount. You don’t control the timing. You control whether the claim is submitted cleanly, whether it’s followed up on when it’s delayed, and whether denials are appealed.
2. Patient copays and coinsurance (collected at the chair)
This is the portion of the fee the patient is responsible for, collected on the day of service. It’s real cash, collected immediately, with no processing delay.
This is the collection source your team has the most control over. Every dollar not collected at the chair becomes a patient balance that needs to be billed, followed up on, and potentially written off. The front desk’s ability to collect copays at the time of service has a direct, measurable impact on your collection rate.
3. Patient balances (billed after insurance pays)
After insurance processes the claim and issues payment, there’s often a remaining patient balance. This is the difference between the contracted fee and what insurance paid, minus any copay already collected. These balances are billed to the patient after the EOB (Explanation of Benefits) arrives.
Patient balance collections are the leakiest part of the revenue cycle. Many practices don’t send statements promptly. Many patients ignore them. The older a patient balance gets, the less likely it is to be collected. Balances over 90 days old collect at roughly 15 to 25%, per Pearly’s dental practice benchmarks. Balances over 120 days are even harder to recover.
4. Third-party financing
CareCredit, Cherry, Sunbit, and Proceed Finance allow patients to finance their treatment. The practice receives payment from the financing company (minus a merchant fee, typically 5 to 15% depending on the plan length) within a few days of the transaction.
From a collections standpoint, third-party financing converts a risky patient balance into a near-immediate payment. The trade-off is the merchant fee. For high-value procedures where the patient might not otherwise accept treatment, the economics usually work. For routine procedures, it’s worth tracking whether the financing fees are worth the collection certainty.
5. Membership plan payments
In-house membership plans (typically $25 to $45 per month, or $300 to $500 annually for an adult individual, per the ADA’s overview of in-office plans) create a recurring revenue stream from uninsured patients. The patient pays a monthly or annual fee for preventive care and receives discounts on other procedures. Collections from membership plans are predictable, have no claims processing, and carry no carrier risk.
Membership plans are a small percentage of total collections for most practices, but they’re the highest-quality collections: no lag, no write-offs, no denials, no aging balances.
Where Money Leaks
Every dental practice loses some revenue between production and the bank. The goal is to minimize it. Here are the most common leaks, roughly in order of financial impact.
Uncollected copays at the front desk
This is the single biggest controllable leak in most dental practices. When a patient leaves without paying their copay, that amount becomes a patient balance. Patient balance collection rates are significantly lower than point-of-service collection rates. Every $100 copay that walks out the door yields a fraction of that amount after statements, follow-up calls, and write-offs. Sometimes nothing at all.
The fix is simple but requires discipline: verify insurance benefits and estimated patient responsibility before the appointment. Collect at checkout. Train the front desk to ask for payment as a standard part of the checkout process, not as an afterthought.
Claims not submitted promptly
Every day a claim sits unsubmitted is a day of delayed collections. Carrier filing deadlines vary widely, ranging from 90 days for many PPOs (Cigna, UnitedHealthcare, Ameritas) to 12 months for Delta Dental and Medicare, per Teero’s timely-filing reference. Missing the deadline means the claim is denied entirely. Even within the deadline, delayed submission means delayed payment.
Best practice: submit claims daily, or at minimum within 48 hours of the procedure. Electronic submission is faster and has fewer errors than paper. If your practice is still submitting paper claims to any carrier, that’s a process worth fixing.
Denied claims not reworked
Claims get denied. It happens. The question is what happens next. In many practices, denied claims sit in a queue. Some get reworked. Some don’t. The ones that don’t are revenue that was earned but never collected.
Common denial reasons that are usually resolvable: incorrect patient information, missing pre-authorization, coordination of benefits issues, incorrect procedure codes. These are fixable. They require someone to review the denial, correct the issue, and resubmit. Practices without a dedicated follow-up process lose roughly 1 to 3% of gross production to unworked denials, derived from a 10 to 15% denial rate combined with the Pearl AI finding that 65% of denied claims are never resubmitted.
Patient balances not followed up on
The lifecycle of a patient balance matters. A statement sent within 2 weeks of the EOB has a much higher collection probability than one sent 60 days later. A patient balance that gets a phone call at 30 days is far more likely to be paid than one that only gets mailed statements.
Many practices don’t have a defined follow-up cadence. The result: balances age, collection probability drops, and eventually the balance is written off. A structured follow-up process (statement at 2 weeks, reminder at 30 days, phone call at 45 days, final notice at 60 days) recovers significantly more than passive monthly statements alone.
The Numbers That Tell You Where You Stand
Collection rate (net collections divided by net production): This is the master metric. 96 to 100% on a trailing basis is the top-performer benchmark. Below 96%, money is leaking somewhere in this pipeline.
Days in accounts receivable: How long, on average, it takes to collect on a claim from the date of service. Below 30 days is healthy; 45 days is the industry average; consistently above 45 needs attention.
Percentage of AR over 90 days: What portion of your outstanding claims are older than 90 days. Healthy target: less than 10% of total AR. Above 15%, aging claims are becoming a real revenue problem.
Point-of-service collection rate: What percentage of estimated patient responsibility is collected at the time of service. Target: 90% or higher. This directly measures front desk performance.
Denial rate: What percentage of submitted claims are initially denied. 5 to 10% is best-in-class; 10 to 15% is the industry average. If yours is above 15%, there’s likely a submission quality issue worth investigating.
What Your Accounting Should Show You
If your monthly financial reporting only shows total deposits, you’re missing the story. Useful collections reporting breaks down:
Collections by source: insurance, patient (combining at-chair, balances, and membership plan), and third-party financing
Collection rate trended over 3, 6, and 12 months
Aging summary: how much is outstanding at 30, 60, 90, and 90+ days
Most general bookkeepers record deposits as a single revenue entry. A dental-specific accountant breaks collections down by source and ties them back to production, which is what turns a deposit ledger into an actual management tool.
Frequently Asked Questions
What is a good collection rate for a dental practice?
96 to 100% of net production, measured on a trailing 3 to 12 month basis. This means you’re collecting nearly everything you’re entitled to after contractual adjustments. Practices below 95% have a meaningful revenue leak that’s worth investigating.
How long should it take to collect from insurance?
Clean electronic claims should be paid within 14 to 30 days. Paper claims take longer. Claims requiring additional documentation, coordination of benefits, or pre-authorization review can take 30 to 60 days. If your average days in AR is consistently above 45, your claim submission or follow-up process needs attention.
What percentage of revenue should come from insurance vs. patients?
This varies by payer mix, but most general dental practices collect 50 to 70% from insurance and 30 to 50% from patients (copays, balances, cash-pay, and financing combined). Practices with a large fee-for-service or membership-plan population may see a higher patient percentage. There’s no single right ratio, but knowing yours helps you understand where your collection risk is concentrated.
Should we write off old patient balances?
Patient balances over 120 days old have very low collection probability. Continuing to carry them inflates your accounts receivable and makes your collection rate look worse than it is. Most practices benefit from a quarterly review of aged balances with a clear write-off policy: if a balance has been through the full follow-up cycle and the patient hasn’t responded, write it off as bad debt. This is different from a contractual adjustment and should be categorized separately in your books.
P.S. Reciprocity Accounting breaks down collections by source and ties them back to production for every dental practice client. If your current financials only show a deposit total, we can show you what’s actually happening by reaching out at reciprocityaccounting.com.
Sources
Pearly: Practice Benchmarking for Accounts Receivable
Pearl AI: 13 Tips to Reduce Dental Insurance Denials and Improve Collections
Dental Claim Support: How often should my dental office be sending insurance claims?
Teero: What Is Timely Filing for Insurance Claims
Dental Economics: Benchmarking Payment Goals
American Dental Association: Is an in-office dental plan right for your practice?
Related reading on the Reciprocity blog:
What Are Dental Production and Collections, and Why Does the Difference Matter?
Why Cash Basis Accounting Misleads Dental Practice Owners
How Insurance Timing Distorts Your Dental Practice Financials